CHAPTER 9
INEQUALITY
But is it all going to the rich?” That’s a natural question to ask in developed countries in the second decade of the 21st century, when economic inequality has become an obsession. Pope Francis called it “the root of social evil”; Barack Obama, “the defining challenge of our time.” Between 2009 and 2016, the proportion of articles in the New York Times containing the word inequality soared tenfold, reaching 1 in 73.1 The new conventional wisdom is that the richest one percent have skimmed off all the economic growth of recent decades, and everyone else is treading water or slowly sinking. If so, the explosion of wealth documented in the previous chapter would no longer be worth celebrating, since it would have ceased contributing to overall human welfare.
Economic inequality has long been a signature issue of the left, and it rose in prominence after the Great Recession began in 2007. It ignited the Occupy Wall Street movement in 2011 and the presidential candidacy of the self-described socialist Bernie Sanders in 2016, who proclaimed that “a nation will not survive morally or economically when so few have so much, while so many have so little.”2 But in that year the revolution devoured its children and propelled the candidacy of Donald Trump, who claimed that the United States had become “a third-world country” and blamed the declining fortunes of the working class not on Wall Street and the one percent but on immigration and foreign trade. The left and right ends of the political spectrum, incensed by economic inequality for their different reasons, curled around to meet each other, and their shared cynicism about the modern economy helped elect the most radical American president in recent times.
Has rising inequality really immiserated the majority of citizens? Economic inequality undoubtedly has increased in most Western countries since its low point around 1980, particularly in the United States and other English-speaking countries, and especially in the contrast between the very richest and everyone else.3 Economic inequality is usually measured by the Gini coefficient, a number that can vary between 0, when everyone has the same as everyone else, and 1, when one person has everything and everyone else has nothing. (Gini values generally range from .25 for the most egalitarian income distributions, such as in Scandinavia after taxes and benefits, to .7 for a highly unequal distribution such as the one in South Africa.) In the United States, the Gini index for market income (before taxes and benefits) rose from .44 in 1984 to .51 in 2012. Inequality can also be measured by the proportion of total income that is earned by a given fraction (quantile) of the population. In the United States, the share of income going to the richest one percent grew from 8 percent in 1980 to 18 percent in 2015, while the share going to the richest tenth of one percent grew from 2 percent to 8 percent.4
There’s no question that some of the phenomena falling under the inequality rubric (there are many) are serious and must be addressed, if only to defuse the destructive agendas they have incited, such as abandoning market economies, technological progress, and foreign trade. Inequality is devilishly complicated to analyze (in a population of one million, there are 999,999 ways in which they can be unequal), and the subject has filled many books. I need a chapter on the topic because so many people have been swept up in the dystopian rhetoric and see inequality as a sign that modernity has failed to improve the human condition. As we will see, this is wrong, and for many reasons.

The starting point for understanding inequality in the context of human progress is to recognize that income inequality is not a fundamental component of well-being. It is not like health, prosperity, knowledge, safety, peace, and the other areas of progress I examine in these chapters. The reason is captured in an old joke from the Soviet Union. Igor and Boris are dirt-poor peasants, barely scratching enough crops from their small plots of land to feed their families. The only difference between them is that Boris owns a scrawny goat. One day a fairy appears to Igor and grants him a wish. Igor says, “I wish that Boris’s goat should die.”
The point of the joke, of course, is that the two peasants have become more equal but that neither is better off, aside from Igor’s indulging his spiteful envy. The point is made with greater nuance by the philosopher Harry Frankfurt in his 2015 book On Inequality.5 Frankfurt argues that inequality itself is not morally objectionable; what is objectionable is poverty. If a person lives a long, healthy, pleasurable, and stimulating life, then how much money the Joneses earn, how big their house is, and how many cars they drive are morally irrelevant. Frankfurt writes, “From the point of view of morality, it is not important everyone should have the same. What is morally important is that each should have enough.”6 Indeed, a narrow focus on economic inequality can be destructive if it distracts us into killing Boris’s goat instead of figuring out how Igor can get one.
The confusion of inequality with poverty comes straight out of the lump fallacy—the mindset in which wealth is a finite resource, like an antelope carcass, which has to be divvied up in zero-sum fashion, so that if some people end up with more, others must have less. As we just saw, wealth is not like that: since the Industrial Revolution, it has expanded exponentially.7 That means that when the rich get richer, the poor can get richer, too. Even experts repeat the lump fallacy, presumably out of rhetorical zeal rather than conceptual confusion. Thomas Piketty, whose 2014 bestseller Capital in the Twenty-First Century became a talisman in the uproar over inequality, wrote, “The poorer half of the population are as poor today as they were in the past, with barely 5 percent of total wealth in 2010, just as in 1910.”8 But total wealth today is vastly greater than it was in 1910, so if the poorer half own the same proportion, they are far richer, not “as poor.”
A more damaging consequence of the lump fallacy is the belief that if some people get richer, they must have stolen more than their share from everyone else. A famous illustration by the philosopher Robert Nozick, updated for the 21st century, shows why this is wrong.9 Among the world’s billionaires is J. K. Rowling, author of the Harry Potter novels, which have sold more than 400 million copies and have been adapted into a series of films seen by a similar number of people.10 Suppose that a billion people have handed over $10 each for the pleasure of a Harry Potter paperback or movie ticket, with a tenth of the proceeds going to Rowling. She has become a billionaire, increasing inequality, but she has made people better off, not worse off (which is not to say that every rich person has made people better off). This doesn’t mean that Rowling’s wealth is just deserts for her effort or skill, or a reward for the literacy and happiness she added to the world; no committee ever judged that she deserved to be that rich. Her wealth arose as a by-product of the voluntary decisions of billions of book buyers and moviegoers.
To be sure, there may be reasons to worry about inequality itself, not just poverty. Perhaps most people are like Igor and their happiness is determined by how they compare with their fellow citizens rather than how well-off they are in absolute terms. When the rich get too rich, everyone else feels poor, so inequality lowers well-being even if everyone gets richer. This is an old idea in social psychology, variously called the theory of social comparison, reference groups, status anxiety, or relative deprivation.11 But the idea must be kept in perspective. Imagine Seema, an illiterate woman in a poor country who is village-bound, has lost half her children to disease, and will die at fifty, as do most of the people she knows. Now imagine Sally, an educated person in a rich country who has visited several cities and national parks, has seen her children grow up, and will live to eighty, but is stuck in the lower middle class. It’s conceivable that Sally, demoralized by the conspicuous wealth she will never attain, is not particularly happy, and she might even be unhappier than Seema, who is grateful for small mercies. Yet it would be mad to suppose that Sally is not better off, and positively depraved to conclude that one may as well not try to improve Seema’s life because it might improve her neighbors’ lives even more and leave her no happier.12
In any case, the thought experiment is moot, because in real life Sally almost certainly is happier. Contrary to an earlier belief that people are so mindful of their richer compatriots that they keep resetting their internal happiness meter to the baseline no matter how well they are doing, we will see in chapter 18 that richer people and people in richer countries are (on average) happier than poorer people and people in poorer countries.13
But even if people are happier when they and their countries get richer, might they become more miserable if others around them are still richer than they are—that is, as economic inequality increases? In their well-known book The Spirit Level, the epidemiologists Richard Wilkinson and Kate Pickett claim that countries with greater income inequality also have higher rates of homicide, imprisonment, teen pregnancy, infant mortality, physical and mental illness, social distrust, obesity, and substance abuse.14 The economic inequality causes the ills, they argue: unequal societies make people feel that they are pitted in a winner-take-all competition for dominance, and the stress makes them sick and self-destructive.
The Spirit Level theory has been called “the left’s new theory of everything,” and it is as problematic as any other theory that leaps from a tangle of correlations to a single-cause explanation. For one thing, it’s not obvious that people are whipped into competitive anxiety by the existence of J. K. Rowling and Sergey Brin as opposed to their own, local rivals for professional, romantic, and social success. Worse, economically egalitarian countries like Sweden and France differ from lopsided countries like Brazil and South Africa in many ways other than their income distribution. The egalitarian countries are, among other things, richer, better educated, better governed, and more culturally homogeneous, so a raw correlation between inequality and happiness (or any other social good) may show only that there are many reasons why it’s better to live in Denmark than in Uganda. Wilkinson and Pickett’s sample was restricted to developed countries, but even within that sample the correlations are evanescent, coming and going with choices about which countries to include.15 Wealthy but unequal countries, such as Singapore and Hong Kong, are often socially healthier than poorer but more equal countries, such as those of ex-Communist Eastern Europe.
Most damagingly, the sociologists Jonathan Kelley and Mariah Evans have snipped the causal link joining inequality to happiness in a study of two hundred thousand people in sixty-eight societies over three decades.16 (We will examine how happiness and life satisfaction are measured in chapter 18.) Kelley and Evans held constant the major factors that are known to affect happiness, including GDP per capita, age, sex, education, marital status, and religious attendance, and found that the theory that inequality causes unhappiness “comes to shipwreck on the rock of the facts.” In developing countries, inequality is not dispiriting but heartening: people in the more unequal societies are happier. The authors suggest that whatever envy, status anxiety, or relative deprivation people may feel in poor, unequal countries is swamped by hope. Inequality is seen as a harbinger of opportunity, a sign that education and other routes to upward mobility might pay off for them and their children. Among developed countries (other than formerly Communist ones), inequality made no difference one way or another. (In formerly Communist countries, the effects were also equivocal: inequality hurt the aging generation that grew up under communism, but helped or made no difference to the younger generations.)
The fickle effects of inequality on well-being bring up another common confusion in these discussions: the conflation of inequality with unfairness. Many studies in psychology have shown that people, including young children, prefer windfalls to be split evenly among participants, even if everyone ends up with less overall. That led some psychologists to posit a syndrome called inequity aversion: an apparent desire to spread the wealth. But in their recent article “Why People Prefer Unequal Societies,” the psychologists Christina Starmans, Mark Sheskin, and Paul Bloom took another look at the studies and found that people prefer unequal distributions, both among fellow participants in the lab and among citizens in their country, as long as they sense that the allocation is fair: that the bonuses go to harder workers, more generous helpers, or even the lucky winners of an impartial lottery.17 “There is no evidence so far,” the authors conclude, “that children or adults possess any general aversion to inequality.” People are content with economic inequality as long as they feel that the country is meritocratic, and they get angry when they feel it isn’t. Narratives about the causes of inequality loom larger in people’s minds than the existence of inequality. That creates an opening for politicians to rouse the rabble by singling out cheaters who take more than their fair share: welfare queens, immigrants, foreign countries, bankers, or the rich, sometimes identified with ethnic minorities.18
In addition to effects on individual psychology, inequality has been linked to several kinds of society-wide dysfunction, including economic stagnation, financial instability, intergenerational immobility, and political influence-peddling. These harms must be taken seriously, but here too the leap from correlation to causation has been contested.19 Either way, I suspect that it’s less effective to aim at the Gini index as a deeply buried root cause of many social ills than to zero in on solutions to each problem: investment in research and infrastructure to escape economic stagnation, regulation of the finance sector to reduce instability, broader access to education and job training to facilitate economic mobility, electoral transparency and finance reform to eliminate illicit influence, and so on. The influence of money on politics is particularly pernicious because it can distort every government policy, but it’s not the same issue as income inequality. After all, in the absence of electoral reform the richest donors can get the ear of politicians whether they earn 2 percent of national income or 8 percent of it.20
Economic inequality, then, is not itself a dimension of human well-being, and it should not be confused with unfairness or with poverty. Let’s now turn from the moral significance of inequality to the question of why it has changed over time.
The simplest narrative of the history of inequality is that it comes with modernity. We must have begun in a state of original equality, because when there is no wealth, everyone has equal shares of nothing, and then, when wealth is created, some can have more of it than others. Inequality, in this story, started at zero, and as wealth increased over time, inequality grew with it. But the story is not quite right.
Hunter-gatherers are by all appearances highly egalitarian, a fact that inspired Marx and Engels’s theory of “primitive communism.” But ethnographers point out that the image of forager egalitarianism is misleading. For one thing, the hunter-gatherer bands that are still around for us to study are not representative of an ancestral way of life, because they have been pushed into marginal lands and lead nomadic lives that make the accumulation of wealth impossible, if for no other reason than that it would be a nuisance to carry around. But sedentary hunter-gatherers, such as the natives of the Pacific Northwest, which is flush with salmon, berries, and fur-bearing animals, were florid inegalitarians, and developed a hereditary nobility who kept slaves, hoarded luxuries, and flaunted their wealth in gaudy potlatches. Also, while nomadic hunter-gatherers share meat, since hunting is largely a matter of luck and sharing a windfall insures everyone against days in which they come home empty-handed, they are less likely to share plant foods, since gathering is a matter of effort, and indiscriminate sharing would allow free-riding.21 Some degree of inequality is universal across societies, as is an awareness of inequality.22 A recent survey of inequality in the forms of wealth that are possible for hunter-gatherers (houses, boats, and hunting and foraging returns) found that they were “far from a state of ‘primitive communism’”: the Ginis averaged .33, close to the value for disposable income in the United States in 2012.23
What happens when a society starts to generate substantial wealth? An increase in absolute inequality (the difference between the richest and poorest) is almost a mathematical necessity. In the absence of an Income Distribution Authority that parcels out identical shares, some people are bound to take greater advantage of the new opportunities than others, whether by luck, skill, or effort, and they will reap disproportionate rewards.
An increase in relative inequality (measured by the Gini or income shares) is not mathematically necessary, but it is highly likely. According to a famous conjecture by the economist Simon Kuznets, as countries get richer they should get less equal, because some people leave farming for higher-paying lines of work while the rest stay in rural squalor. But eventually a rising tide lifts all the boats. As more of the population gets swept into the modern economy, inequality should decline, tracing out an inverted U. This hypothetical arc of inequality over time is called the Kuznets curve.24
In the preceding chapter we saw hints of a Kuznets curve for inequality between countries. As the Industrial Revolution gathered steam, European countries made a Great Escape from universal poverty, leaving the other countries behind. As Deaton observes, “A better world makes for a world of differences; escapes make for inequality.”25 Then, as globalization proceeded and wealth-generating know-how spread, poor countries started catching up in a Great Convergence. We saw hints of a drop in global inequality in the blastoff of GDP in Asian countries (figure 8-2), in the morphing of the world income distribution from snail to two-humped camel to one-humped dromedary (figure 8-3), and in the plunging proportion (figure 8-4) and number (figure 8-5) of people living in extreme poverty.
To confirm that these gains really constitute a decline in inequality—that poor countries are getting richer faster than the rich countries are getting richer—we need a single measure that combines them, an international Gini, which treats each country like a person. Figure 9-1 shows that the international Gini rose from a low of .16 in 1820, when all countries were poor, to a high of .56 in 1970, when some were rich, and then, as Kuznets predicted, it plateaued and began to droop in the 1980s.26 But an international Gini is a bit misleading, because it counts an improvement in the living standards of a billion Chinese as equivalent to an improvement in the standards of, say, four million Panamanians. Figure 9-1 also shows an international Gini calculated by the economist Branko Milanović in which every country counts in proportion to its population, making the human impact of the drop in inequality more apparent.

Figure 9-1: International inequality, 1820–2013
Sources: International inequality: OECD Clio Infra Project, Moatsos et al. 2014; data are for market household income across countries. Population-weighted international inequality: Milanović 2012; data for 2012 and 2013 provided by Branko Milanović, personal communication.
Still, an international Gini treats all the Chinese as if they earned the same amount, all the Americans as if they earned the American average, and so on, and as a result it underestimates inequality across the human race. A global Gini, in which every person counts the same, regardless of country, is harder to calculate, because it requires mixing the incomes from disparate countries into a single bowl, but two estimates are shown in figure 9-2. The lines float at different heights because they were calibrated in dollars adjusted for purchasing parity in different years, but their slopes trace out a kind of Kuznets curve: after the Industrial Revolution, global inequality rose steadily until around 1980, then started to fall. The international and global Gini curves show that despite the anxiety about rising inequality within Western countries, inequality in the world is declining. That’s a circuitous way to state the progress, though: what’s significant about the decline in inequality is that it’s a decline in poverty.

Figure 9-2: Global inequality, 1820–2011
Source: Milanović 2016, fig. 3.1. The left-hand curve shows 1990 international dollars of disposable income per capita; the right-hand curve shows 2005 international dollars, and combines household surveys of per capita disposable income and consumption.
The version of inequality that has generated the recent alarm is the inequality within developed countries like the United States and the United Kingdom. The long view of these countries is shown in figure 9-3. Until recently, both countries traveled a Kuznets arc. Inequality rose during the Industrial Revolution and then began to fall, first gradually in the late 19th century, then steeply in the middle decades of the 20th. But then, starting around 1980, inequality bounced into a decidedly un-Kuznetsian rise. Let’s examine each segment in turn.

Figure 9-3: Inequality, UK and US, 1688–2013
Source: Milanović 2016, fig. 2.1, disposable income per capita.
The rise and fall in inequality in the 19th century reflects Kuznets’s expanding economy, which gradually pulls more people into urban, skilled, and thus higher-paying occupations. But the 20th-century plunge—which has been called the Great Leveling or the Great Compression—had more sudden causes. The plunge overlaps the two world wars, and that is no coincidence: major wars often level the income distribution.27 Wars destroy wealth-generating capital, inflate away the assets of creditors, and induce the rich to put up with higher taxes, which the government redistributes into the paychecks of soldiers and munition workers, in turn increasing the demand for labor in the rest of the economy.
Wars are just one kind of catastrophe that can generate equality by the logic of Igor and Boris. The historian Walter Scheidel identifies “Four Horsemen of Leveling”: mass-mobilization warfare, transformative revolution, state collapse, and lethal pandemics. In addition to obliterating wealth (and, in the communist revolutions, the people who owned it), the four horsemen reduce inequality by killing large numbers of workers, driving up the wages of those who survive. Scheidel concludes, “All of us who prize greater economic equality would do well to remember that with the rarest of exceptions it was only ever brought forth in sorrow. Be careful what you wish for.”28
Scheidel’s warning applies to the long run of history. But modernity has brought a more benign way to reduce inequality. As we have seen, a market economy is the best poverty-reduction program we know of for an entire country. It is ill-equipped, however, to provide for individuals within that country who have nothing to exchange: the young, the old, the sick, the unlucky, and others whose skills and labor are not valuable enough to others for them to earn a decent living in return. (Another way of putting it is that a market economy maximizes the average, but we also care about the variance and the range.) As the circle of sympathy in a country expands to encompass the poor (and as people want to insure themselves should they ever become poor), they increasingly allocate a portion of their pooled resources—that is, government funds—to alleviating that poverty. Those resources have to come from somewhere. They may come from a corporate or sales tax, or a sovereign wealth fund, but in most countries they largely come from a graduated income tax, in which richer citizens pay at a higher rate because they don’t feel the loss as sharply. The net result is “redistribution,” but that is something of a misnomer, because the goal is to raise the bottom, not lower the top, even if in practice the top is lowered.
Those who condemn modern capitalist societies for callousness toward the poor are probably unaware of how little the pre-capitalist societies of the past spent on poor relief. It’s not just that they had less to spend in absolute terms; they spent a smaller proportion of their wealth. A much smaller proportion: from the Renaissance through the early 20th century, European countries spent an average of 1.5 percent of their GDP on poor relief, education, and other social transfers. In many countries and periods, they spent nothing at all.29
In another example of progress, sometimes called the Egalitarian Revolution, modern societies now devote a substantial chunk of their wealth to health, education, pensions, and income support.30 Figure 9-4 shows that social spending took off in the middle decades of the 20th century (in the United States, with the New Deal in the 1930s; in other developed countries, with the rise of the welfare state after World War II). Social spending now takes up a median of 22 percent of their GDP.31

Figure 9-4: Social spending, OECD countries, 1880–2016
Source: Our World in Data, Ortiz-Ospina & Roser 2016b, based on data from Lindert 2004 and OECD 1985, 2014, 2017. The Organisation for Economic Co-operation and Development includes thirty-five democratic states with market economies.
The explosion in social spending has redefined the mission of government: from warring and policing to also nurturing.32 Governments underwent this transformation for several reasons. Social spending inoculates citizens against the appeal of communism and fascism. Some of the benefits, like universal education and public health, are public goods that accrue to everyone, not just the direct beneficiaries. Many of the programs indemnify citizens against misfortunes for which they can’t or won’t insure themselves (hence the euphemism “social safety net”). And assistance to the needy assuages the modern conscience, which cannot bear the thought of the Little Match Girl freezing to death, Jean Valjean imprisoned for stealing bread to save his starving sister, or the Joads burying Grampa by the side of Route 66.
Since there’s no point in everyone sending money to the government and getting it right back (minus the bureaucracy’s cut), social spending is designed to help people who have less money, with the bill footed by people who have more money. This is the principle known as redistribution, the welfare state, social democracy, or socialism (misleadingly, because free-market capitalism is compatible with any amount of social spending). Whether or not the social spending is designed to reduce inequality, that is one of its effects, and the rise in social expenditures from the 1930s through the 1970s explains part of the decline in the Gini.
Social spending demonstrates an uncanny aspect of progress that we’ll encounter again in subsequent chapters.33 Though I am skittish about any notion of historical inevitability, cosmic forces, or mystical arcs of justice, some kinds of social change really do seem to be carried along by an inexorable tectonic force. As they proceed, certain factions oppose them hammer and tongs, but resistance turns out to be futile. Social spending is an example. The United States is famously resistant to anything smacking of redistribution. Yet it allocates 19 percent of its GDP to social services, and despite the best efforts of conservatives and libertarians the spending has continued to grow. The most recent expansions are a prescription drug benefit introduced by George W. Bush and the eponymous health insurance plan known as Obamacare introduced by his successor.
Indeed, social spending in the United States is even higher than it appears, because many Americans are forced to pay for health, retirement, and disability benefits through their employers rather than the government. When this privately administered social spending is added to the public portion, the United States vaults from twenty-fourth into second place among the thirty-five OECD countries, just behind France.34
For all their protestations against big government and high taxes, people like social spending. Social Security has been called the third rail of American politics, because if politicians touch it they die. According to legend, an irate constituent at a town-hall meeting warned his representative, “Keep your government hands off my Medicare” (referring to the government health insurance program for seniors).35 No sooner did Obamacare pass than the Republican Party made it a sacred cause to repeal it, but each of their assaults on it after gaining control of the presidency in 2017 was beaten back by angry citizens at town-hall meetings and legislators afraid of their ire. In Canada the top two national pastimes (after hockey) are complaining about their health care system and boasting about their health care system.
Developing countries today, like developed countries a century ago, stint on social spending. Indonesia, for example, spends 2 percent of its GDP, India 2.5 percent, and China 7 percent. But as they get richer they become more munificent, a phenomenon called Wagner’s Law.36 Between 1985 and 2012 Mexico quintupled its proportion of social spending, and Brazil’s now stands at 16 percent.37 Wagner’s Law appears to be not a cautionary tale about overweening government and bureaucratic bloat but a manifestation of progress. The economist Leandro Prados de la Escosura found a strong correlation between the percentage of GDP that an OECD country allocated to social transfers as it developed between 1880 and 2000 and its score on a composite measure of prosperity, health, and education.38 And tellingly, the number of libertarian paradises in the world—developed countries without substantial social spending—is zero.39
The correlation between social spending and social well-being holds only up to a point: the curve levels off starting at around 25 percent and may even drop off at higher proportions. Social spending, like everything, has downsides. As with all insurance, it can create a “moral hazard” in which the insured slack off or take foolish risks, counting on the insurer to bail them out if they fail. And since the premiums have to cover the payouts, if the actuaries get the numbers wrong or the numbers change so that more money is taken out than put in, the system can collapse. In reality social spending is never exactly like insurance but is a combination of insurance, investment, and charity. Its success thus depends on the degree to which the citizens of a country sense they are part of one community, and that fellow feeling can be strained when the beneficiaries are disproportionately immigrants or ethnic minorities.40 These tensions are inherent to social spending and will always be politically contentious. Though there is no “correct amount,” all developed states have decided that the benefits of social transfers outweigh the costs and have settled on moderately large amounts, cushioned by their massive wealth.
Let’s complete our tour of the history of inequality by turning to the final segment in figure 9-3, the rise of inequality in wealthy nations that began around 1980. This is the development that inspired the claim that life has gotten worse for everyone but the richest. The rebound defies the Kuznets curve, in which inequality was supposed to have settled into a low equilibrium. Many explanations have been proffered for this surprise.41 Wartime restrictions on economic competition may have been sticky, outlasting World War II, but they finally dissipated, freeing the rich to get richer from their investment income and opening up an arena of dynamic economic competition with winner-take-all payoffs. The ideological shift associated with Ronald Reagan and Margaret Thatcher slowed the movement toward greater social spending financed by taxes on the rich while eroding social norms against extravagant salaries and conspicuous wealth. As more people stayed single or got divorced, and at the same time more power couples pooled two fat paychecks, the variance in income from household to household was bound to increase, even if the paychecks had stayed the same. A “second industrial revolution” driven by electronic technologies replayed the Kuznets rise by creating a demand for highly skilled professionals, who pulled away from the less educated at the same time that the jobs requiring less education were eliminated by automation. Globalization allowed workers in China, India, and elsewhere to underbid their American competitors in a worldwide labor market, and the domestic companies that failed to take advantage of these offshoring opportunities were outcompeted on price. At the same time, the intellectual output of the most successful analysts, entrepreneurs, investors, and creators was increasingly available to a gargantuan worldwide market. The Pontiac worker is laid off, while J. K. Rowling becomes a billionaire.
Milanović has combined the two inequality trends of the past thirty years—declining inequality worldwide, increasing inequality within rich countries—into a single graph which pleasingly takes the shape of an elephant (figure 9-5). This “growth incidence curve” sorts the world’s population into twenty numerical bins or quantiles, from poorest to richest, and plots how much each bin gained or lost in real income per capita between 1988 (just before the fall of the Berlin Wall) and 2008 (just before the Great Recession).
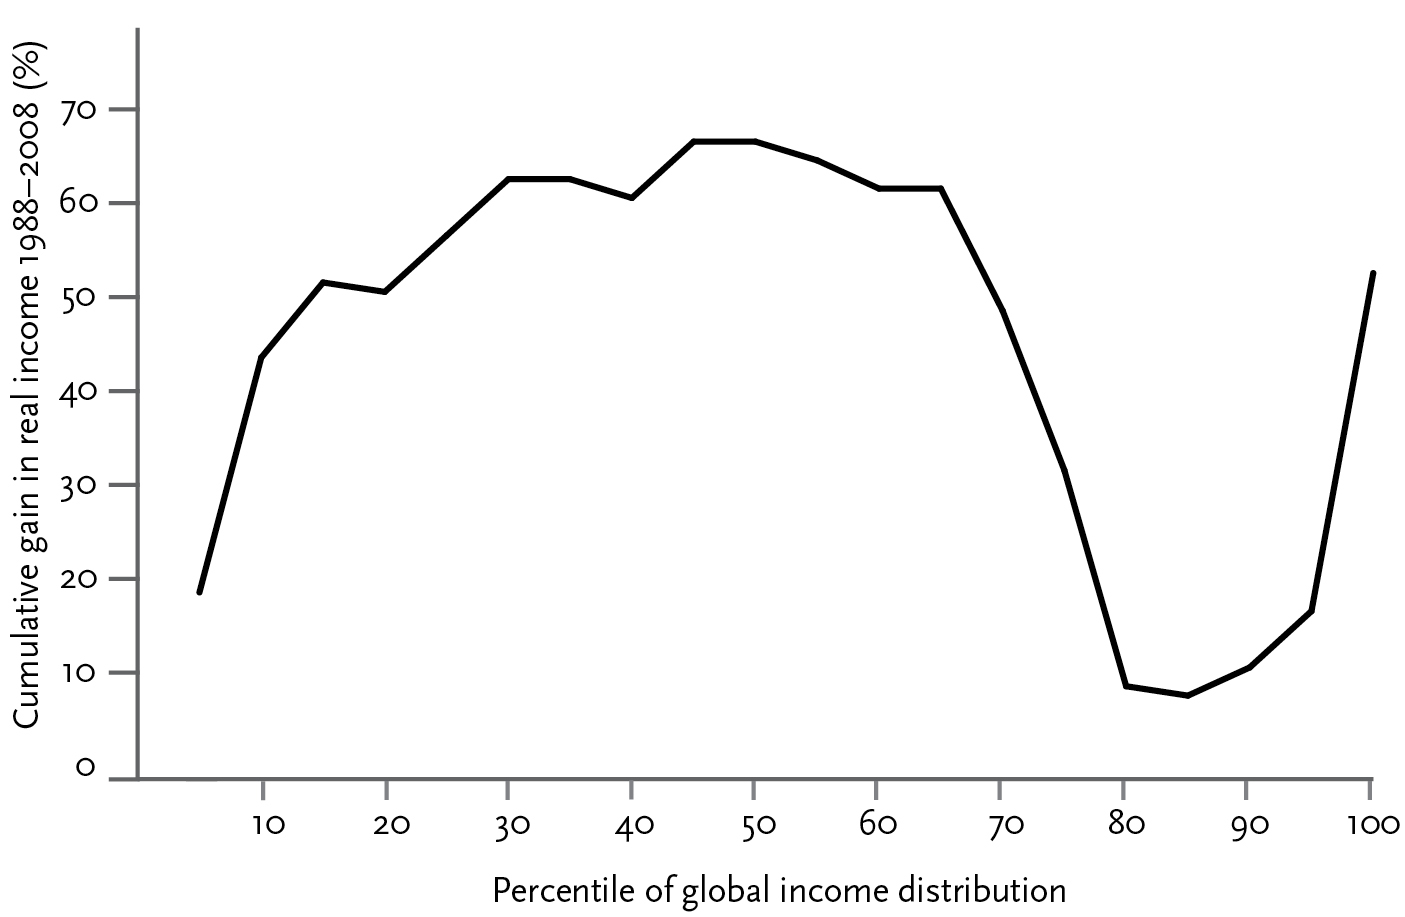
Figure 9-5: Income gains, 1988–2008
Source: Milanović 2016, fig. 1.3.
The cliché about globalization is that it creates winners and losers, and the elephant curve displays them as peaks and valleys. It reveals that the winners include most of humanity. The elephant’s bulk (its body and head), which includes about seven-tenths of the world’s population, consists of the “emerging global middle class,” mainly in Asia. Over this period they saw cumulative gains of 40 to 60 percent in their real incomes. The nostrils at the tip of the trunk consist of the world’s richest one percent, who also saw their incomes soar. The rest of the trunk tip, which includes the next 4 percent down, didn’t do badly either. Where the bend of the trunk hovers over the floor around the 85th percentile we see globalization’s “losers”: the lower middle classes of the rich world, who gained less than 10 percent. These are the focus of the new concern about inequality: the “hollowed-out middle class,” the Trump supporters, the people globalization left behind.
I couldn’t resist plotting the most recognizable elephant in Milanović’s herd, because it serves as a vivid mnemonic for the effects of globalization (and it rounds out a nice menagerie with the camel and dromedary in figure 8-3). But the curve makes the world look more unequal than it really is, for two reasons. One is that the financial crisis of 2008, which postdated the graph, had a strangely equalizing effect on the world. The Great Recession, Milanović points out, was really a recession in North Atlantic countries. The incomes of the world’s richest one percent were trimmed, but the incomes of workers elsewhere soared (in China, they doubled). Three years after the crisis we still see an elephant, but it has lowered the tip of its trunk while arching its back twice as high.42
The other elephant-distorter is a conceptual point that bedevils many discussions of inequality. Whom are we talking about when we say “the bottom fifth” or “the top one percent”? Most income distributions use what economists call anonymous data: they track statistical ranges, not actual people.43 Suppose I told you that the age of the median American declined from thirty in 1950 to twenty-eight in 1970. If your first thought is “Wow, how did that guy get two years younger?” then you have confused the two: the “median” is a rank, not a person. Readers commit the same fallacy when they read that “the top one percent in 2008” had incomes that were 50 percent higher than “the top one percent in 1988” and conclude that a bunch of rich people got half again richer. People move in and out of income brackets, shuffling the order, so we’re not necessarily talking about the same individuals. The same is true for “the bottom fifth” and every other statistical bin.
Nonanonymous or longitudinal data, which track people over time, are unavailable in most countries, so Milanović did the next best thing and tracked individual quantiles in particular countries, so that, say, poor Indians in 1988 were no longer being compared with poor Ghanaians in 2008.44 He still got an elephantoid, but with a much higher tail and haunches, because the poorer classes of so many countries rose out of extreme poverty. The pattern remains—globalization helped the lower and middle classes of poor countries, and the upper class of rich countries, much more than it helped the lower middle class of rich countries—but the differences are less extreme.
Now that we have run through the history of inequality and seen the forces that push it around, we can evaluate the claim that the growing inequality of the past three decades means that the world is getting worse—that only the rich have prospered, while everyone else is stagnating or suffering. The rich certainly have prospered more than anyone else, perhaps more than they should have, but the claim about everyone else is not accurate, for a number of reasons.
Most obviously, it’s false for the world as a whole: the majority of the human race has become much better off. The two-humped camel has become a one-humped dromedary; the elephant has a body the size of, well, an elephant; extreme poverty has plummeted and may disappear; and both international and global inequality coefficients are in decline. Now, it’s true that the world’s poor have gotten richer in part at the expense of the American lower middle class, and if I were an American politician I would not publicly say that the tradeoff was worth it. But as citizens of the world considering humanity as a whole, we have to say that the tradeoff is worth it.
But even in the lower and lower middle classes of rich countries, moderate income gains are not the same as a decline in living standards. Today’s discussions of inequality often compare the present era unfavorably with a golden age of well-paying, dignified, blue-collar jobs that have been made obsolete by automation and globalization. This idyllic image is belied by contemporary depictions of the harshness of working-class life in that era, both in journalistic exposés (such as Michael Harrington’s 1962 The Other America) and in realistic films (such as On the Waterfront, Blue Collar, Coal Miner’s Daughter, and Norma Rae). The historian Stephanie Coontz, a debunker of 1950s nostalgia, puts some numbers to the depictions:
A full 25 percent of Americans, 40 to 50 million people, were poor in the mid-1950s, and in the absence of food stamps and housing programs, this poverty was searing. Even at the end of the 1950s, a third of American children were poor. Sixty percent of Americans over sixty-five had incomes below $1,000 in 1958, considerably below the $3,000 to $10,000 level considered to represent middle-class status. A majority of elders also lacked medical insurance. Only half the population had savings in 1959; one-quarter of the population had no liquid assets at all. Even when we consider only native-born, white families, one-third could not get by on the income of the household head.45
How do we reconcile the obvious improvements in living standards in recent decades with the conventional wisdom of economic stagnation? Economists point to four ways in which inequality statistics can paint a misleading picture of the way people live their lives, each depending on a distinction we have examined.
The first is the difference between relative and absolute prosperity. Just as not all children can be above average, it’s not a sign of stagnation if the proportion of income earned by the bottom fifth does not increase over time. What’s relevant to well-being is how much people earn, not how high they rank. A recent study by the economist Stephen Rose divided the American population into classes using fixed milestones rather than quantiles. “Poor” was defined as an income of $0–$30,000 (in 2014 dollars) for a family of three, “lower middle class” as $30,000–$50,000, and so on.46 The study found that in absolute terms, Americans have been moving on up. Between 1979 and 2014, the percentage of poor Americans dropped from 24 to 20, the percentage in the lower middle class dropped from 24 to 17, and the percentage in the middle class shrank from 32 to 30. Where did they go? Many ended up in the upper middle class ($100,000–$350,000), which grew from 13 to 30 percent of the population, and in the upper class, which grew from 0.1 percent to 2 percent. The middle class is being hollowed out in part because so many Americans are becoming affluent. Inequality undoubtedly increased—the rich got richer faster than the poor and middle class got richer—but everyone (on average) got richer.
The second confusion is the one between anonymous and longitudinal data. If (say) the bottom fifth of the American population gained no ground in twenty years, it does not mean that Joe the Plumber got the same paycheck in 1988 that he did in 2008 (or one that’s a bit higher, owing to cost-of-living increases). People earn more as they get older and gain experience, or switch from a lower-paying job to a higher-paying one, so Joe may have moved from the bottom fifth into, say, the middle fifth, while a younger man or woman or an immigrant took his place at the bottom. The turnover is by no means small. A recent study using longitudinal data showed that half of Americans will find themselves among the top tenth of income earners for at least one year of their working lives, and that one in nine will find themselves in the top one percent (though most don’t stay there for long).47 This may be one of the reasons that economic opinions are subject to the Optimism Gap (the “I’m OK, They’re Not” bias): a majority of Americans believe that the standard of living of the middle class has declined in recent years but that their own standard of living has improved.48
A third reason that rising inequality has not made the lower classes worse off is that low incomes have been mitigated by social transfers. For all its individualist ideology, the United States has a lot of redistribution. The income tax is still graduated, and low incomes are buffered by a “hidden welfare state” that includes unemployment insurance, Social Security, Medicare, Medicaid, Temporary Assistance for Needy Families, food stamps, and the Earned Income Tax Credit, a kind of negative income tax in which the government boosts the income of low earners. Put them together and America becomes far less unequal. In 2013 the Gini index for American market income (before taxes and transfers) was a high .53; for disposable income (after taxes and transfers) it was a moderate .38.49 The United States has not gone as far as countries like Germany and Finland, which start off with a similar market income distribution but level it more aggressively, pushing their Ginis down into the high .2s and sidestepping most of the post-1980s inequality rise. Whether or not the generous European welfare state is sustainable over the long run and transplantable to the United States, some kind of welfare state may be found in all developed countries, and it reduces inequality even when it is hidden.50
These transfers have not just reduced income inequality (in itself a dubious accomplishment) but boosted the incomes of the nonrich (a real one). An analysis by the economist Gary Burtless has shown that between 1979 and 2010 the disposable incomes of the lowest four income quintiles grew by 49, 37, 36, and 45 percent, respectively.51 And that was before the long-delayed recovery from the Great Recession: between 2014 and 2016, median wages leapt to an all-time high.52
Even more significant is what has happened at the bottom of the scale. Both the left and the right have long expressed cynicism about antipoverty programs, as in Ronald Reagan’s famous quip, “Some years ago, the federal government declared war on poverty, and poverty won.” In reality, poverty is losing. The sociologist Christopher Jencks has calculated that when the benefits from the hidden welfare state are added up, and the cost of living is estimated in a way that takes into account the improving quality and falling price of consumer goods, the poverty rate has fallen in the past fifty years by more than three-quarters, and in 2013 stood at 4.8 percent.53 Three other analyses have come to the same conclusion; data from one of them, by the economists Bruce Meyer and James Sullivan, are shown in the upper line in figure 9-6. The progress stagnated around the time of the Great Recession, but it picked up in 2015 and 2016 (not shown in the graph), when middle-class income reached a record high and the poverty rate showed its largest drop since 1999.54 And in yet another unsung accomplishment, the poorest of the poor—the unsheltered homeless—fell in number between 2007 and 2015 by almost a third, despite the Great Recession.55

Figure 9-6: Poverty, US, 1960–2016
Sources: Meyer & Sullivan 2017. “Disposable income” refers to their “After-tax money income,” including credits, adjusted for inflation using the bias-corrected CPI-U-RS, and representing a family with two adults and two children. “Consumption” refers to data from the BLS Consumer Expenditure Survey on food, housing, vehicles, appliances, furnishings, clothing, jewelry, insurance, and other expenses. “Poverty” corresponds to the US Census definition for 1980, adjusted for inflation; anchoring the poverty line in other years would result in different absolute numbers but the same trends. See Meyer & Sullivan 2011, 2012, and 2016 for details.
The lower line in figure 9-6 highlights the fourth way in which inequality measures understate the progress of the lower and middle classes in rich countries.56 Income is just a means to an end: a way of paying for things that people need, want, and like, or as economists gracelessly call it, consumption. When poverty is defined in terms of what people consume rather than what they earn, we find that the American poverty rate has declined by ninety percent since 1960, from 30 percent of the population to just 3 percent. The two forces that have famously increased inequality in income have at the same time decreased inequality in what matters. The first, globalization, may produce winners and losers in income, but in consumption it makes almost everyone a winner. Asian factories, container ships, and efficient retailing bring goods to the masses that were formerly luxuries for the rich. (In 2005 the economist Jason Furman estimated that Walmart saved the typical American family $2,300 a year.)57 The second force, technology, continually revolutionizes the meaning of income (as we saw in the discussion of the paradox of value in chapter 8). A dollar today, no matter how heroically adjusted for inflation, buys far more betterment of life than a dollar yesterday. It buys things that didn’t exist, like refrigeration, electricity, toilets, vaccinations, telephones, contraception, and air travel, and it transforms things that do exist, such as a party line patched by a switchboard operator to a smartphone with unlimited talk time.
Together, technology and globalization have transformed what it means to be a poor person, at least in developed countries. The old stereotype of poverty was an emaciated pauper in rags. Today, the poor are likely to be as overweight as their employers, and dressed in the same fleece, sneakers, and jeans. The poor used to be called the have-nots. In 2011, more than 95 percent of American households below the poverty line had electricity, running water, flush toilets, a refrigerator, a stove, and a color TV.58 (A century and a half before, the Rothschilds, Astors, and Vanderbilts had none of these things.) Almost half of the households below the poverty line had a dishwasher, 60 percent had a computer, around two-thirds had a washing machine and a clothes dryer, and more than 80 percent had an air conditioner, a video recorder, and a cell phone. In the golden age of economic equality in which I grew up, middle-class “haves” had few or none of these things. As a result, the most precious resources of all—time, freedom, and worthy experiences—are rising across the board, a topic we will explore in chapter 17.
The rich have gotten richer, but their lives haven’t gotten that much better. Warren Buffett may have more air conditioners than most people, or better ones, but by historical standards the fact that a majority of poor Americans even have an air conditioner is astonishing. When the Gini index is calculated over consumption rather than income, it has remained shallow or flat.59 Inequality in self-reported happiness in the American population has actually declined.60 And though I find it distasteful, even grotesque, to celebrate declining Ginis for life, health, and education (as if killing off the healthiest and keeping the smartest out of school would be good for humanity), they have in fact declined for the right reasons: the lives of the poor are improving more rapidly than the lives of the rich.61
To acknowledge that the lives of the lower and middle classes of developed countries have improved in recent decades is not to deny the formidable problems facing 21st-century economies. Though disposable income has increased, the pace of the increase is slow, and the resulting lack of consumer demand may be dragging down the economy as a whole.62 The hardships faced by one sector of the population—middle-aged, less-educated, non-urban white Americans—are real and tragic, manifested in higher rates of drug overdose (chapter 12) and suicide (chapter 18). Advances in robotics threaten to make millions of additional jobs obsolete. Truck drivers, for example, make up the most common occupation in a majority of states, and self-driving vehicles may send them the way of scriveners, wheelwrights, and switchboard operators. Education, a major driver of economic mobility, is not keeping up with the demands of modern economies: tertiary education has soared in cost (defying the inexpensification of almost every other good), and in poor American neighborhoods, primary and secondary education are unconscionably substandard. Many parts of the American tax system are regressive, and money buys too much political influence. Perhaps most damaging, the impression that the modern economy has left most people behind encourages Luddite and beggar-thy-neighbor policies that would make everyone worse off.
Still, a narrow focus on income inequality and a nostalgia for the mid-20th-century Great Compression are misplaced. The modern world can continue to improve even if the Gini index or top income shares stay high, as they may well do, because the forces that lifted them are not going away. Americans cannot be forced to buy Pontiacs instead of Priuses. The Harry Potter books will not be kept out of the hands of the world’s children just because they turn J. K. Rowling into a billionaire. It makes little sense to make tens of millions of poor Americans pay more for clothing to save tens of thousands of jobs in the apparel industry.63 Nor does it make sense, in the long term, to have people do boring and dangerous jobs that could be carried out more effectively by machines just to give them remunerable work.64
Rather than tilting at inequality per se it may be more constructive to target the specific problems lumped with it.65 An obvious priority is to boost the rate of economic growth, since it would increase everyone’s slice of the pie and provide more pie to redistribute.66 The trends of the past century, and a survey of the world’s countries, point to governments playing an increasing role in both. They are uniquely suited to invest in education, basic research, and infrastructure, to underwrite health and retirement benefits (relieving American corporations of their enervating mandate to provide social services), and to supplement incomes to a level above their market price, which for millions of people may decline even as overall wealth rises.67
The next step in the historic trend toward greater social spending may be a universal basic income (or its close relative, a negative income tax). The idea has been bruited for decades, and its day may be coming.68 Despite its socialist aroma, the idea has been championed by economists (such as Milton Friedman), politicians (such as Richard Nixon), and states (such as Alaska) that are associated with the political right, and today analysts across the political spectrum are toying with it. Though implementing a universal basic income is far from easy (the numbers have to add up, and incentives for education, work, and risk-taking have to be maintained), its promise cannot be ignored. It could rationalize the kludgy patchwork of the hidden welfare state, and it could turn the slow-motion disaster of robots replacing workers into a horn of plenty. Many of the jobs that robots will take over are jobs that people don’t particularly enjoy, and the dividend in productivity, safety, and leisure could be a boon to humanity as long as it is widely shared. The specter of anomie and meaninglessness is probably exaggerated (according to studies of regions that have experimented with a guaranteed income), and it could be met with public jobs that markets won’t support and robots can’t do, or with new opportunities in meaningful volunteering and other forms of effective altruism.69 The net effect might be to reduce inequality, but that would be a side effect of raising everyone’s standard of living, particularly that of the economically vulnerable.
Income inequality, in sum, is not a counterexample to human progress, and we are not living in a dystopia of falling incomes that has reversed the centuries-long rise in prosperity. Nor does it call for smashing the robots, raising the drawbridge, switching to socialism, or bringing back the 50s. Let me sum up my complicated story on a complicated topic.
Inequality is not the same as poverty, and it is not a fundamental dimension of human flourishing. In comparisons of well-being across countries, it pales in importance next to overall wealth. An increase in inequality is not necessarily bad: as societies escape from universal poverty, they are bound to become more unequal, and the uneven surge may be repeated when a society discovers new sources of wealth. Nor is a decrease in inequality always good: the most effective levelers of economic disparities are epidemics, massive wars, violent revolutions, and state collapse.
For all that, the long-term trend in history since the Enlightenment is for everyone’s fortunes to rise. In addition to generating massive amounts of wealth, modern societies have devoted an increasing proportion of that wealth to benefiting the less well-off.
As globalization and technology have lifted billions out of poverty and created a global middle class, international and global inequality have decreased, at the same time that they enrich elites whose analytical, creative, or financial impact has global reach. The fortunes of the lower classes in developed countries have not improved nearly as much, but they have improved, often because their members rise into the upper classes. The improvements are enhanced by social spending, and by the falling cost and rising quality of the things people want. In some ways the world has become less equal, but in more ways the world’s people have become better off.